From a pdf table to an interactive map with locations
I recently took a deep dive into my wardrobe and discovered a bunch of clothes that I'd completely forgotten about. Instead of letting them collect dust, I decided to do a good deed and donate them to charity. But here's the twist: I only had a massive list of charity boxes in my voivodeship, over two thousand of them, with just city and street addresses. I didn't want to manually search each address, so I put on my tech hat and whipped up a small script. It transformed the PDF list into a handy Pandas dataset, found map coordinates for each location, and voila! I had them all displayed on a map. Curious how I pulled it off? Let me give you a quick tutorial on how I made it happen.
🎓 What you'll learn below?
- How to parse table from pdf document into a pandas dataframe.
- How to query geo coordinates for the address string in Python.
- How to display locations on a map in Python.
Libraries you'll need: camelot, geopandas, pandas,
geopy, keplergl.
If you want to follow this tutorial with the same pdf doucment, you can get the table from here or simply run:
wget https://pck.pl/tekstylia/files/pojemniki-wielkopolskie.pdf
Let's import libraries we'll need and begin.
import camelot
import geopandas as gpd
import pandas as pd
from geopy.geocoders import Bing
from keplergl import KeplerGl
Parsing pdf table into pandas dataframe
First we need to parse the pdf table into a pandas dataframe. This is pretty straightforward
with the camelot library.
tables = camelot.read_pdf("pojemniki-wielkopolskie.pdf", pages="1-38")
I've parsed pages 1-38 (not all, as is possible with "all" option) to optimize the reading process. This doucment contains over a thousend pages, but only first 38 contain information, the rest is empty.
💡 Tip for using
cameloton MacOS Camelot requires Ghostscript and Tkinter dependencies. I didn't have any problems with Tkinter installation (brew install tcl-tk). But Had some troubles with making Ghostscript run. I've tried multiple fixes and finally found this Stack Overflow answer, which have worked for me. To correctly install and setup ghostscript I did:brew install ghostscript conda install ghostscript # if fails then: conda install -c conda-forge ghostscript pip install ghostscript
tables
<TableList n=37>
37 individual table were parsed. Now we need to concatenate them to a single dataframe.
table_df = pd.concat([table.df for table in tables]).reset_index(drop=True)
table_df.columns = table_df.iloc[0]
table_df = table_df.iloc[1:]
table_df.head()
| Miejscowość | Powiat | Adres lokalizacji | Numer | |
|---|---|---|---|---|
| 1 | Chrzypsko Wielkie | międzychodzki | Chrzypsko ul. Szkolna\nChrzypsko ul. Jeziorna\... | 87649\n87645\n87651\n87654\n87646 |
| 2 | Czarnków | czarnkowsko-\ntrzcianecki | Huta\nGębice\nBrzeźno\nSarbka\nMarunowo\nRoman... | 47289\n38863\n50674\n61254\n38864\n47298\n5153... |
| 3 | Drawsko | czarnkowsko-\ntrzcianecki | Drawski Młyn dz. 793/5\nDrawski Młyn dz. 793/5... | 9385\n63159\n45201\n47294\n28355\n1szt.\n41126... |
| 4 | Koźmin Wlkp | krotoszyński | Koźmin Wlkp ul. Benedykta z Koźmina\nKoźmin Wl... | 94789\n94794\n88879\n88875\n88880 |
| 5 | Margonin | chodzieski | Margonin ul. Mickiewicza\nMargonin ul. Broniew... | 40831\n45189\n7449\n95443\n59233\n48394\n21611... |
Names of the columns are in Polish so for more clarity, we'll translate them.
CITY_COL = "city"
COUNTY_COL = "county"
ADDRESS_COL = "address"
NUMBER_COL = "number"

col_names_map = {
    "Miejscowość": CITY_COL,
    "Powiat": COUNTY_COL,
    "Adres lokalizacji": ADDRESS_COL,
    "Numer": NUMBER_COL,
}

table_df.columns = table_df.columns.map(col_names_map)
table_df.head()
| city | county | address | number | |
|---|---|---|---|---|
| 1 | Chrzypsko Wielkie | międzychodzki | Chrzypsko ul. Szkolna\nChrzypsko ul. Jeziorna\... | 87649\n87645\n87651\n87654\n87646 |
| 2 | Czarnków | czarnkowsko-\ntrzcianecki | Huta\nGębice\nBrzeźno\nSarbka\nMarunowo\nRoman... | 47289\n38863\n50674\n61254\n38864\n47298\n5153... |
| 3 | Drawsko | czarnkowsko-\ntrzcianecki | Drawski Młyn dz. 793/5\nDrawski Młyn dz. 793/5... | 9385\n63159\n45201\n47294\n28355\n1szt.\n41126... |
| 4 | Koźmin Wlkp | krotoszyński | Koźmin Wlkp ul. Benedykta z Koźmina\nKoźmin Wl... | 94789\n94794\n88879\n88875\n88880 |
| 5 | Margonin | chodzieski | Margonin ul. Mickiewicza\nMargonin ul. Broniew... | 40831\n45189\n7449\n95443\n59233\n48394\n21611... |
The address and number columns have multiline strings in them, were
each line corresponds to a separate charity box. We'll need to expand them to individual
rows. But first, I've noticed that, because of those multiline values, some cells in the pdf
file start on the one page and end on the other. This results in the empty values for the
first two columns (city and county).
table_df.loc[
    (table_df.loc[:, CITY_COL] == "") | (table_df.loc[:, COUNTY_COL] == "")
].shape
(46, 4)
However, we know, that those values should be the same as in the row above them. Therefore we can easily impute them.
for col in [0, 1]:
    for i in range(len(table_df)):
        if table_df.iloc[i, col] == "":
            table_df.iloc[i, col] = prev_val
        prev_val = table_df.iloc[i, col]
Let's make sure we don't have empty values in those columns anymore.
assert table_df.loc[
    (table_df.loc[:, CITY_COL] == "") | (table_df.loc[:, COUNTY_COL] == "")
].empty
I'm interested only in boxes located in the Poznań city. So to speed up following steps, let's filter only relevant rows.
table_df = table_df.query(f"`{CITY_COL}` == 'Poznań'")
table_df.shape
(24, 4)
Now, we can expand multiline strings in address and number fields
into individual rows. First, we'll split those lines to lists.
table_df = table_df.assign(
    **{ADDRESS_COL: table_df.loc[:, ADDRESS_COL].str.split("\n")}
).assign(**{NUMBER_COL: table_df.loc[:, NUMBER_COL].str.split("\n")})
table_df.head()
| city | county | address | number | |
|---|---|---|---|---|
| 11 | Poznań | Poznań | [Poznań ul.Dmowskiego 5/7, Poznań ul. Bogusław... | [88485, 87156, 88477, 87852, 88481, 88084, 956... |
| 16 | Poznań | Poznań | [Osiedle Przyjaźni 3 altana śmietnikowa , Osie... | [88601, 88593, 88596, 88603, 88604, 87644, 876... |
| 18 | Poznań | Poznań | [Poznań ul. Dolna Wilda 30-42, Poznań ul. Doln... | [88482, 88484, 87159, 95123, 87160, 87162, 954... |
| 25 | Poznań | Poznań | [Poznań ul. Sarmacka 16, Poznań ul. Sarmacka 1... | [87154, 87155, 87153, 87658, 87655, 87657, 876... |
| 33 | Poznań | Poznań | [Poznań ul. Dębina 17c, Poznań ul. Dębina 16a,... | [88037, 88033, 88036, 38464, 82700] |
Now, we'll make sure lists have the same length for all corresponding address
and number fields.
table_df.loc[
    (table_df.loc[:, ADDRESS_COL].map(len) != table_df.loc[:, NUMBER_COL].map(len))
]
| city | county | address | number | |
|---|---|---|---|---|
| 16 | Poznań | Poznań | [Osiedle Przyjaźni 3 altana śmietnikowa , Osie... | [88601, 88593, 88596, 88603, 88604, 87644, 876... |
There is an issue for one row. It's due to error in parsing. We'll fix it by manually correcting this row data.
table_df.loc[[16]] = pd.DataFrame.from_dict(
    {
        CITY_COL: {16: "Poznań"},
        COUNTY_COL: {16: "Poznań"},
        ADDRESS_COL: {
            16: [
                "Osiedle Przyjaźni 3 altana śmietnikowa ",
                "Osiedle Przyjaźni 10 altana śmietnikowa",
                "Osiedle Przyjaźni 4-10 altana śmietnikowa",
                "Osiedle Przyjaźni 8-9 altana śmietnikowa",
                "Osiedle Przyjaźni 8-9 altana śmietnikowa",
                "Osiedle Przyjaźni 5-7 altana śmietnikowa",
                "Osiedle Przyjaźni  11 altana śmietnikowa",
                "Osiedle Przyjaźni 17 altana śmietnikowa",
                "Osiedle Przyjaźni 23 altana śmietnikowa",
                "Osiedle Przyjaźni 12 altana śmietnikowa",
                "Osiedle Przyjaźni 13 G-F altana śmietnikowa",
                "Osiedle Przyjaźni 18 altana śmietnikowa",
                "Osiedle Przyjaźni 141A altana śmietnikowa , pawilon sklepu Chata Polska",
                "Osiedle Przyjaźni 1-2 altana śmietnikowa",
            ]
        },
        NUMBER_COL: {
            16: [
                "88601",
                "88593",
                "88596",
                "88603",
                "88604",
                "87644",
                "87643",
                "87241",
                "88600",
                "88599",
                "88602",
                "88042",
                "88041",
                "87243",
            ]
        },
    }
)
Let's make sure we've fixed the issue.
assert table_df.loc[
    (table_df.loc[:, ADDRESS_COL].map(len) != table_df.loc[:, NUMBER_COL].map(len))
].empty
Now we can expand lists in address and number columns into separate
rows.
table_df = table_df.explode([ADDRESS_COL, NUMBER_COL])
table_df = table_df.reset_index(drop=True)
table_df.head()
| city | county | address | number | |
|---|---|---|---|---|
| 0 | Poznań | Poznań | Poznań ul.Dmowskiego 5/7 | 88485 |
| 1 | Poznań | Poznań | Poznań ul. Bogusławskiego 16 | 87156 |
| 2 | Poznań | Poznań | Poznań ul. Bogusławskiego 32 | 88477 |
| 3 | Poznań | Poznań | Poznań ul. Bogusławskiego 16 | 87852 |
| 4 | Poznań | Poznań | Poznań ul. Stablewskiego 6 | 88481 |
Some values in address column contain unneccessary duplicate of the city name,
we'll remove it now.
table_df.loc[:, ADDRESS_COL] = table_df.loc[:, ADDRESS_COL].str.replace("Poznań ", "")
Getting geo coordinates for a location name
Now we are ready to get geo coordinates for the addresses in the table. First we'll add a country column and compose a full address field, to make coords search easier.
COUNTRY_COL = "country"
FULL_ADDRESS_COL = "full_address"

table_df[COUNTRY_COL] = "Poland"
table_df[FULL_ADDRESS_COL] = table_df.loc[:, [ADDRESS_COL, CITY_COL, COUNTRY_COL]].agg(
    ",".join, axis="columns"
)
table_df.head()
| city | county | address | number | country | full_address | |
|---|---|---|---|---|---|---|
| 0 | Poznań | Poznań | ul.Dmowskiego 5/7 | 88485 | Poland | ul.Dmowskiego 5/7,Poznań,Poland |
| 1 | Poznań | Poznań | ul. Bogusławskiego 16 | 87156 | Poland | ul. Bogusławskiego 16,Poznań,Poland |
| 2 | Poznań | Poznań | ul. Bogusławskiego 32 | 88477 | Poland | ul. Bogusławskiego 32,Poznań,Poland |
| 3 | Poznań | Poznań | ul. Bogusławskiego 16 | 87852 | Poland | ul. Bogusławskiego 16,Poznań,Poland |
| 4 | Poznań | Poznań | ul. Stablewskiego 6 | 88481 | Poland | ul. Stablewskiego 6,Poznań,Poland |
Now we'll use Bing maps API to get coordinates for our addresses. There are many different APIs available. I've chosen Bing, because it works very well and offers free API key for 125k requests for non-commercial use (you can get it here).
geolocator = Bing("<API-KEY>")
We have the geolocator set up. Now we'll add latitude and longitude columns, and fill them with coordinates from the API.
LAT_COL = "latitude"
LONG_COL = "longitude"

table_df[LAT_COL] = ""
table_df[LONG_COL] = ""
for ind in table_df.index:
    loc = geolocator.geocode(table_df.loc[ind, FULL_ADDRESS_COL])
    table_df.loc[ind, LAT_COL] = loc.latitude
    table_df.loc[ind, LONG_COL] = loc.longitude
table_df.head()
| city | county | address | number | country | full_address | latitude | longitude | |
|---|---|---|---|---|---|---|---|---|
| 0 | Poznań | Poznań | ul.Dmowskiego 5/7 | 88485 | Poland | ul.Dmowskiego 5/7,Poznań,Poland | 52.393064 | 16.900942 |
| 1 | Poznań | Poznań | ul. Bogusławskiego 16 | 87156 | Poland | ul. Bogusławskiego 16,Poznań,Poland | 52.394215 | 16.894152 |
| 2 | Poznań | Poznań | ul. Bogusławskiego 32 | 88477 | Poland | ul. Bogusławskiego 32,Poznań,Poland | 52.392208 | 16.892817 |
| 3 | Poznań | Poznań | ul. Bogusławskiego 16 | 87852 | Poland | ul. Bogusławskiego 16,Poznań,Poland | 52.394215 | 16.894152 |
| 4 | Poznań | Poznań | ul. Stablewskiego 6 | 88481 | Poland | ul. Stablewskiego 6,Poznań,Poland | 52.392838 | 16.8956 |
Let's save it to csv, so we don't need to query the API next time.
table_df.to_csv("donation_boxes_Poznan_df.csv")
Showing geo locations with address info on a map
Now, we can visualize donation boxes on the map. We'll use geopandas and
keplergl libraries for that.
If you just want to test visualization method, wthout parsing pdf and querying the API,
simply load this csv
file.
table_df = pd.read_csv("donation_boxes_Poznan_df.csv", index_col=0)
table_df.head()
| city | county | address | number | country | full_address | latitude | longitude | |
|---|---|---|---|---|---|---|---|---|
| 0 | Poznań | Poznań | ul.Dmowskiego 5/7 | 88485 | Poland | ul.Dmowskiego 5/7,Poznań,Poland | 52.393064 | 16.900942 |
| 1 | Poznań | Poznań | ul. Bogusławskiego 16 | 87156 | Poland | ul. Bogusławskiego 16,Poznań,Poland | 52.394215 | 16.894152 |
| 2 | Poznań | Poznań | ul. Bogusławskiego 32 | 88477 | Poland | ul. Bogusławskiego 32,Poznań,Poland | 52.392208 | 16.892817 |
| 3 | Poznań | Poznań | ul. Bogusławskiego 16 | 87852 | Poland | ul. Bogusławskiego 16,Poznań,Poland | 52.394215 | 16.894152 |
| 4 | Poznań | Poznań | ul. Stablewskiego 6 | 88481 | Poland | ul. Stablewskiego 6,Poznań,Poland | 52.392838 | 16.895600 |
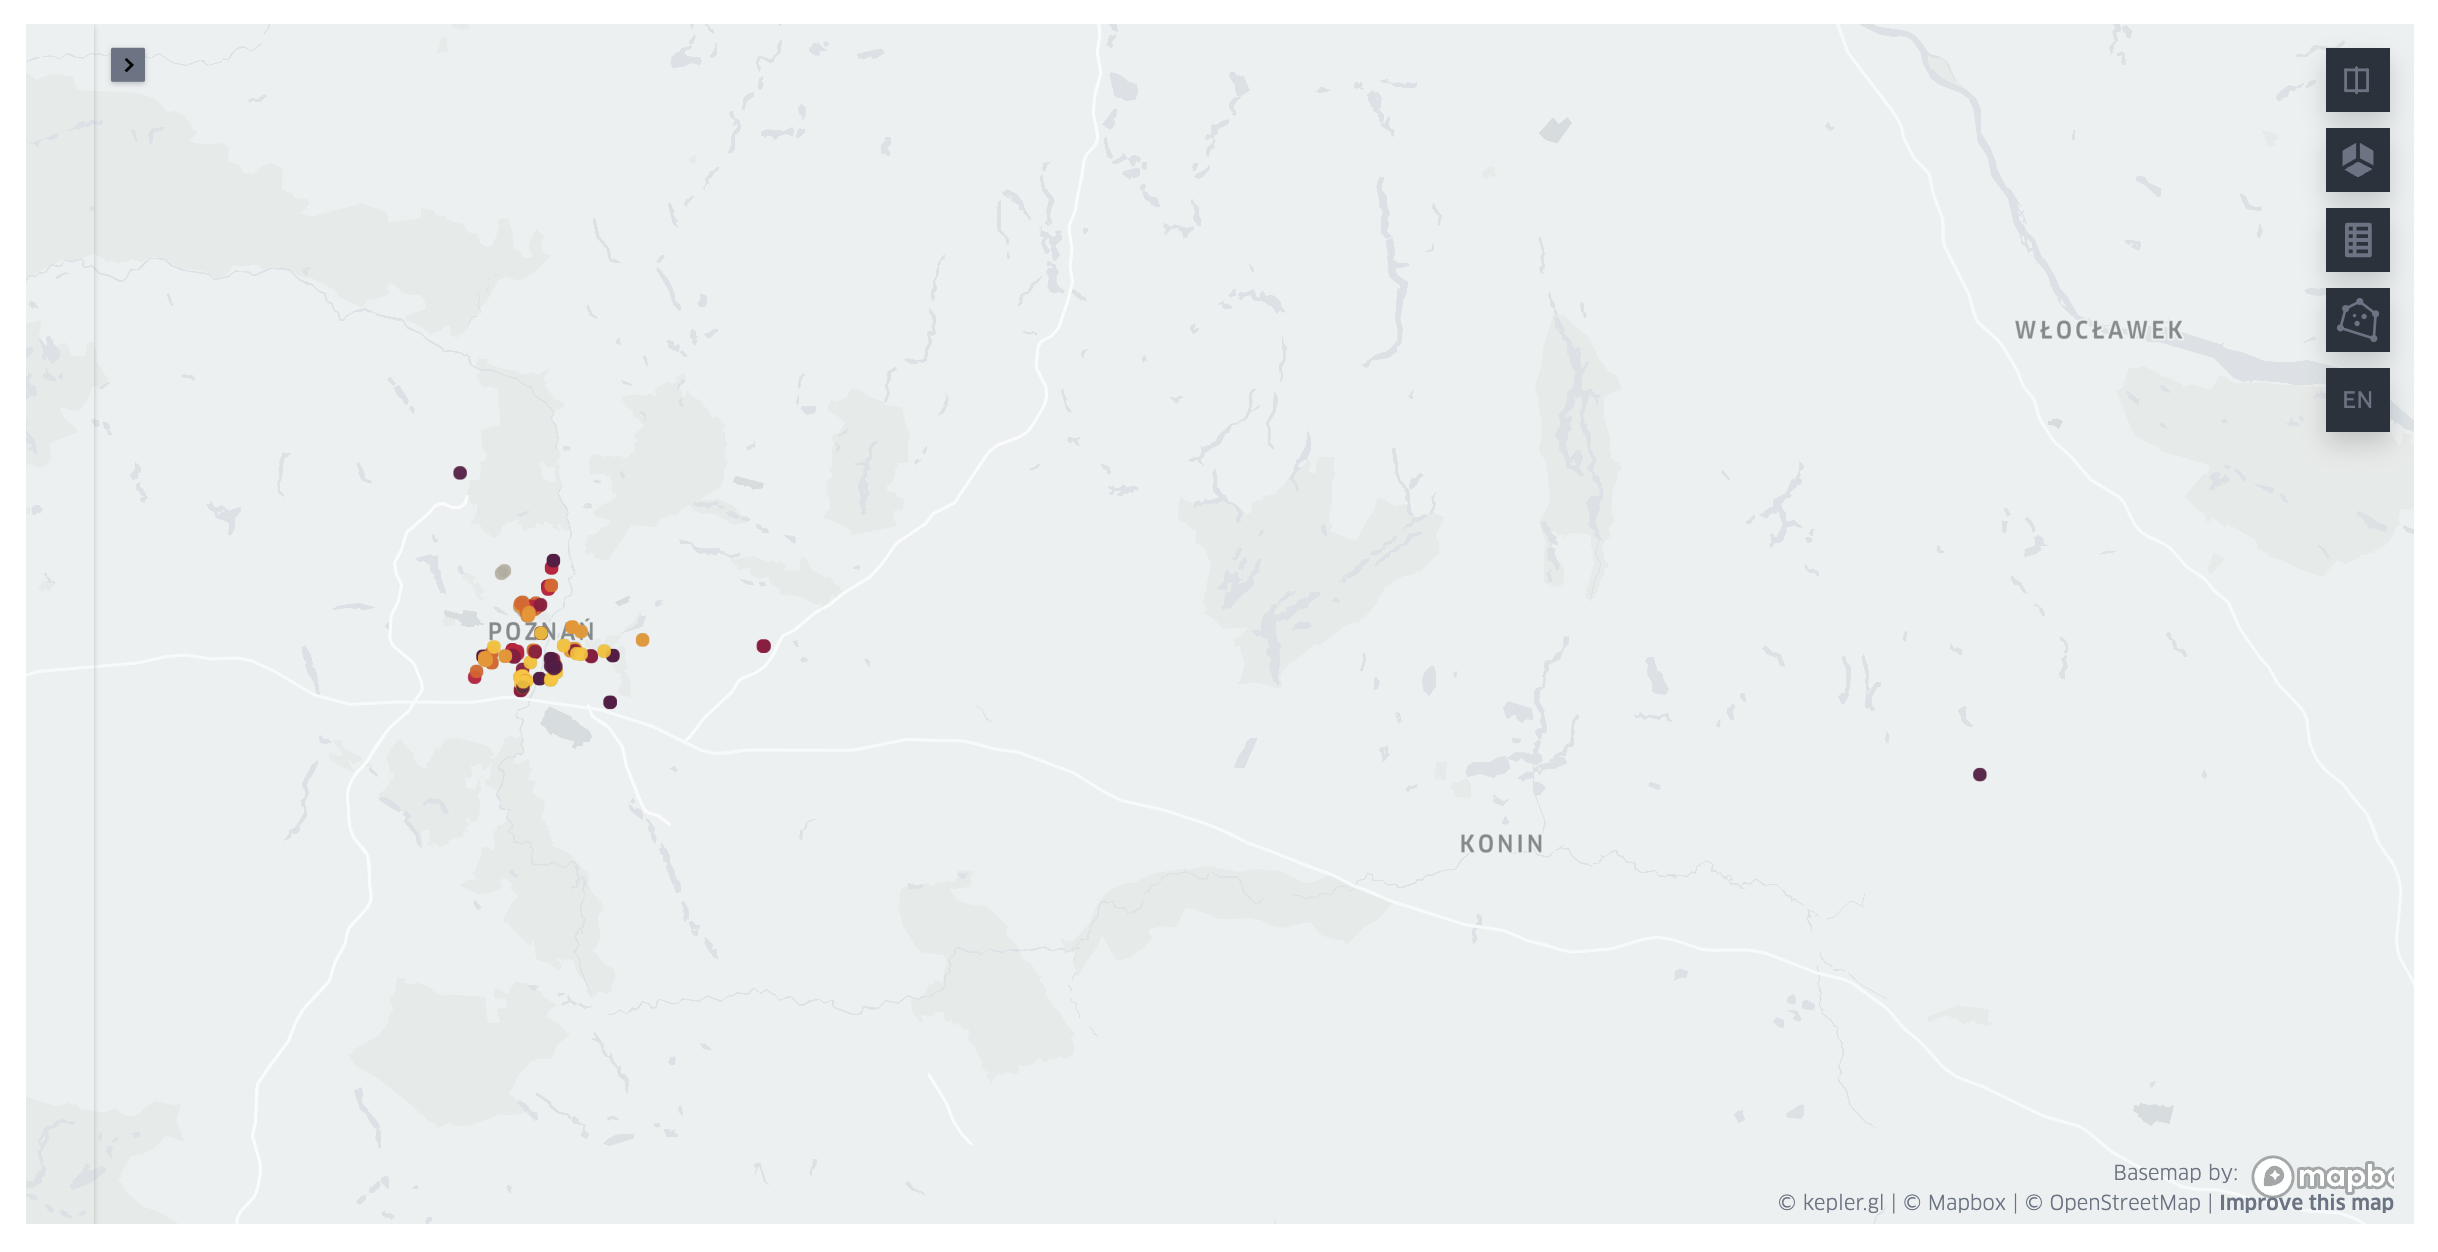
Visualization step is very easy. We'll convert dataframe with address info to
geopandas.GeoDataFrame and then add it to keplergl.KeplerGL map.
(I've also changed map's theme to light. Yes, I use light themes. Crazy, I know.)
map = KeplerGl(
    height=600,
    width=800,
    config={"version": "v1", "config": {"mapStyle": {"styleType": "light"}}},
)

table_geo = gpd.GeoDataFrame(
    table_df,
    geometry=gpd.points_from_xy(table_df.loc[:, LONG_COL], table_df.loc[:, LAT_COL]),
)

map.add_data(data=table_geo, name="charity boxes")
map
User Guide: https://docs.kepler.gl/docs/keplergl-jupyter